Long description: Block6_FigNEWONE2
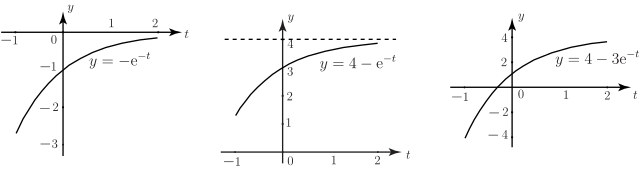
Alt text: Three graphs illustrating exponential decay models, showing the functions \(y = -e^{-t}\), \(y = 4 - e^{-t}\), and \(y = 4 - 3e^{-t}\) plotted over time \(t\).
This description was generated by AI and has not been verified by a human. If you spot an error, please use the feedback link below.
- The first graph plots the function \(y = -e^{-t}\), showing the curve starting from a negative value on the y-axis and increasing as the value of \(t\) increases.
- The second graph plots the function \(y = 4 - e^{-t}\), showing the curve starting from a lower value on the y-axis and increasing, approaching a horizontal asymptote at \(y = 4\).
- The third graph plots the function \(y = 4 - 3e^{-t}\), showing the curve starting from a more negative value on the y-axis than the second graph, and also increasing, approaching a horizontal asymptote at \(y = 4\).