Long description: logdiag
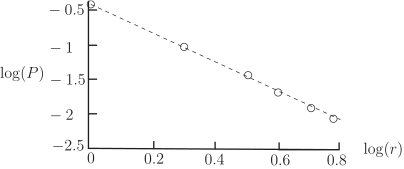
Alt text: A line graph showing a decreasing exponential trend of log(P) versus log(r).
This description was generated by AI and has not been verified by a human. If you spot an error, please use the feedback link below.
- The horizontal axis, labeled \(\log(r)\), ranges from 0 to 0.9, with major ticks at 0.2, 0.4, 0.6, and 0.8\(.
- The vertical axis, labeled \)\log(P)\(, ranges from -2.5 to 0.0, with major ticks at -0.5, -1.0, -1.5, and -2.0\).
- The graph displays a dashed line connecting several data points, illustrating a downward trend.
- Starting at the point \((0, 0.0)\) on the y-intercept, the line slopes consistently downward and to the right.
- At \(\log(r) = 0.4\), the corresponding \(\log(P)\) value is approximately -1.0.
- At \(\log(r) = 0.6\), the corresponding \(\log(P)\) value is approximately -1.5.
- The trend continues such that at \(\log(r) = 0.8\), the value of \(\log(P)\) is slightly below -2.0, near -2.2.