Long description: Block7_Fig6_7
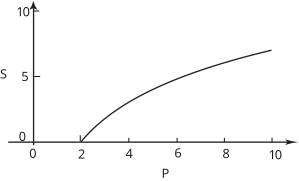
Alt text: A graph showing a curve that increases from near zero at a value of two on the horizontal axis to approximately seven at a value of ten on the horizontal axis.
This description was generated by AI and has not been verified by a human. If you spot an error, please use the feedback link below.
- The vertical axis is labeled with the variable \(S\) and ranges from zero up to ten.
- The horizontal axis is labeled with the variable \(P\) and ranges from zero up to ten.
- A single, continuous curve is plotted on the graph.
- The curve starts near the point \((2, 0)\), indicating that the value of \(S\) is close to zero when \(P\) is close to two.
- As the value of \(P\) increases, the curve rises steadily, showing a positive correlation between \(P\) and \(S\).
- The rate of increase of the curve appears to decrease as \(P\) gets larger; the curve is concave down.
- At the far right end of the visible graph, at \(P=10\), the curve reaches a height of approximately \(7\) on the vertical axis.