Long description: power
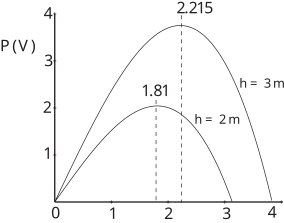
Alt text: A graph showing the transmitted power, \(P\) in volts, as a function of fluid velocity, ranging from zero to four units on the x-axis, for two different head heights, \(h = 2 \text{ m}\) and \(h = 3 \text{ m}\).
This description was generated by AI and has not been verified by a human. If you spot an error, please use the feedback link below.
- The graph plots power, \(P\), on the vertical axis against a horizontal variable, which represents fluid velocity, ranging from \(0\) to \(4\) units.
- Two parabolic curves are visible, each representing the transmitted power for a specific head height, \(h\).
- The curve corresponding to \(h = 3 \text{ m}\) is the upper curve, showing a maximum power of \(4.215\) volts at a velocity of \(2\) units.
- The curve corresponding to \(h = 2 \text{ m}\) is the lower curve, showing a maximum power of \(1.81\) volts at the same velocity of \(2\) units.
- Both curves start at zero power at zero velocity and decrease as the velocity approaches \(4\) units.