Long description: workbook134fig7
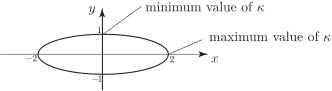
Alt text: A graph showing a horizontal ellipse centered at the origin, with labels indicating the minimum and maximum values of kappa.
This description was generated by AI and has not been verified by a human. If you spot an error, please use the feedback link below.
- The image displays a Cartesian coordinate system with the horizontal axis labeled "x" and the vertical axis labeled "y".
- A horizontally oriented ellipse is drawn on the graph, centered at the origin (0, 0).
- The curve is labeled with associated values for \(\kappa\), indicating the minimum and maximum values of kappa.
- Arrows and labels point to the graph, identifying the "minimum value of \(\kappa\)" and the "maximum value of \(\kappa\)\