Long description: block7fig2
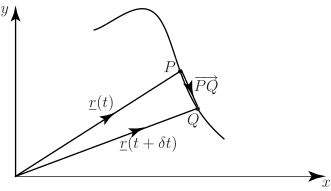
Alt text: A graph shows a curve in the xy-plane with three vectors labeled \(\vec{r}(t)\), \(\vec{P Q}\), and \(\vec{r}(t+\Delta t)\) illustrating displacement and the derivative of position.
This description was generated by AI and has not been verified by a human. If you spot an error, please use the feedback link below.
- The image displays a graph with the horizontal axis labeled \(x\) and the vertical axis labeled \(y\), forming a coordinate system.
- A curved line represents the path or function \(\vec{r}(t)\) in the \(xy\)-plane.
- Three vectors are drawn originating from points on the curve:
- One vector, labeled \(\vec{r}(t)\), points from an earlier point to the point \(P\) on the curve.
- A second vector, labeled \(\vec{P Q}\), points from the point \(P\) to a point \(Q\) on the curve, representing a small change in position.
- A third vector, labeled \(\vec{r}(t+\Delta t)\), points from the starting point to a later point along the curve, suggesting the displacement over a time interval \(\Delta t\).