Long description: zfig21
Alt text: A graph displays a function, f(t), showing two rectangular pulses followed by a smooth, decaying curve over time t.
This description was generated by AI and has not been verified by a human. If you spot an error, please use the feedback link below.
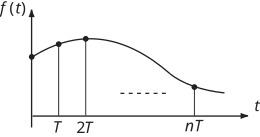
- The graph plots the function f(t) on the vertical axis against time t on the horizontal axis.
- At time t = 0, the function begins at a certain positive value.
- There is a first rectangular pulse shown from time t = 0 to t = T, where the function maintains a constant positive height.
- A second rectangular pulse is depicted from time t = T to t = 2T, maintaining a constant positive height, which appears slightly higher than the first pulse.
- Following the second pulse, the function smoothly decreases from t = 2T towards t = nT.
- At time t = nT, the function reaches a minimum value, close to zero.
- The graph suggests that the signal is composed of discrete pulses followed by an exponentially decaying envelope.