Long description: zfig23
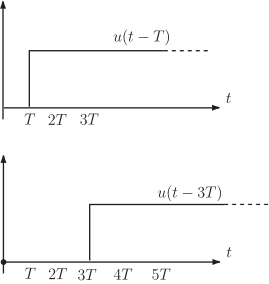
Alt text: Two graphs illustrate the unit step function shifted in time: the first shows \(u(t-T)\) and the second shows \(u(t-3T)\), both defined over a time axis labeled \(t\).
This description was generated by AI and has not been verified by a human. If you spot an error, please use the feedback link below.
- The top graph displays the unit step function, \(u(t-T)\), plotted against a horizontal time axis labeled \(t\) with markers at \(T\), \(2T\), and \(3T\).
- The function's value is zero for times less than \(T\).
- At time \(T\), the function instantaneously jumps to a value of one and remains at one until the end of the displayed axis.
- The bottom graph displays a second instance of the unit step function, \(u(t-3T)\), plotted against the same time axis labeled \(t\) with markers at \(T\), \(2T\), \(3T\), \(4T\), and \(5T\).
- This function's value is zero for times less than \(3T\).
- At time \(3T\), the function instantaneously jumps to a value of one and remains at one for the remainder of the displayed time axis.