2 Periodic functions
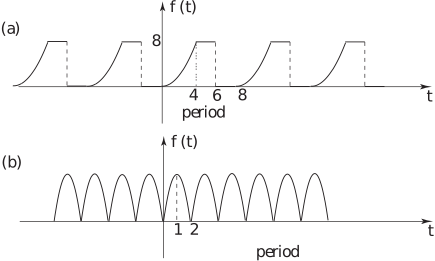
A function is periodic if the function values repeat at regular intervals of the independent variable . The regular interval is referred to as the period . See Figure 1.
Figure 1
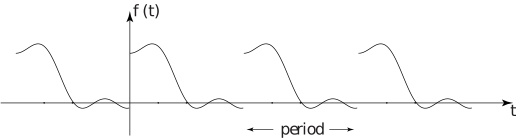
If denotes the period we have
for any value of . The most obvious examples of periodic functions are the trigonometric functions and , both of which have period (using radian measure as we shall do throughout this Workbook) (Figure 2). This follows since
Figure 2
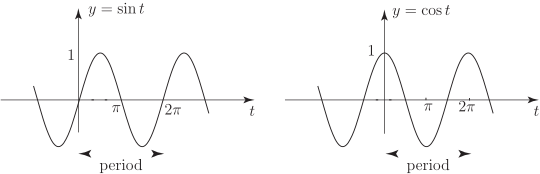
The amplitude of these sinusoidal functions is the maximum displacement from and is clearly 1. (Note that we use the term sinusoidal to include cosine as well as sine functions.)
More generally we can consider a sinusoid
which has maximum value, or amplitude, and where is usually a positive integer.
For example
is a sinusoid of amplitude 1 and period (Figure 3). The fact that the period is follows because
for any value of .
Figure 3
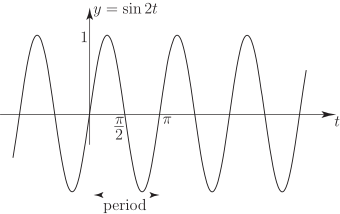
We see that has half the period of , as opposed to (Figure 4). This can alternatively be phrased by stating that oscillates twice as rapidly (or has twice the frequency) of .
Figure 4
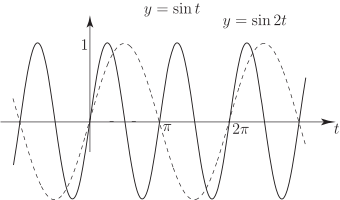
In general has amplitude , period and completes oscillations when changes by . Formally, we define the frequency of a sinusoid as the reciprocal of the period:
and the angular frequency , often denoted the Greek Letter (omega) as
Thus has frequency and angular frequency .
Task!
State the amplitude, period, frequency and angular frequency of
amplitude 5, period , frequency , angular frequency 4
amplitude 6, period , frequency , angular frequency
2.1 Harmonics
In representing a non-sinusoidal function of period by a Fourier series we shall see shortly that only certain sinusoids will be required:
-
(and
)
These also have period and together are referred to as the first harmonic (or
fundamental harmonic ).
-
(and
)
These have half the period, and double the frequency, of the first harmonic and are referred to as the second harmonic .
-
(and
)
These have period and constitute the third harmonic .
In general the Fourier series of a function of period will require harmonics of the type
2.2 Non-sinusoidal periodic functions
The following are examples of non-sinusoidal periodic functions (they are often called “waves”).
Square wave
Figure 5
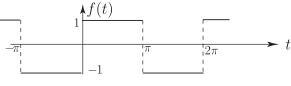
Analytically we can describe this function as follows:
(which gives the definition over one period)
(which tells us that the function has period )
Saw-tooth wave
Figure 6
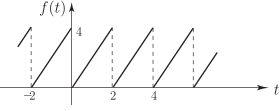
In this case we can describe the function as follows:
Here the period is 2, the frequency is and the angular frequency is . Triangular wave
Figure 7
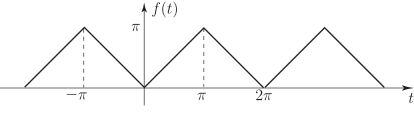
Here we can conveniently define the function using as the “basic period”:
or, more concisely,
together with the usual statement on periodicity
Task!
Write down an analytic definition for the following periodic function:
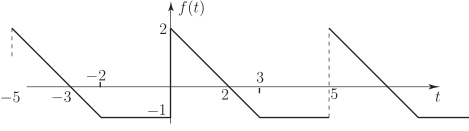
Sketch the graphs of the following periodic functions showing all relevant values: