Long description: Block1fig1
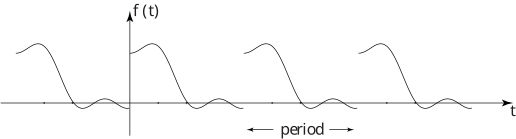
Alt text: The image displays a graph of a periodic function, f(t), over time, t.
This description was generated by AI and has not been verified by a human. If you spot an error, please use the feedback link below.
- The vertical axis is labeled with the function, f(t), and the horizontal axis is labeled with time, t.
- The graph shows a continuous, wave-like curve that repeats its pattern over time, indicating a periodic function.
- Several complete cycles of the wave are visible, starting from a high point, crossing the time axis, reaching a minimum, returning to the time axis, reaching a maximum, and completing another cycle.
- A double-headed arrow beneath the graph, marked "period," indicates the horizontal length required for the function to complete one full cycle.