Long description: Block1fig2
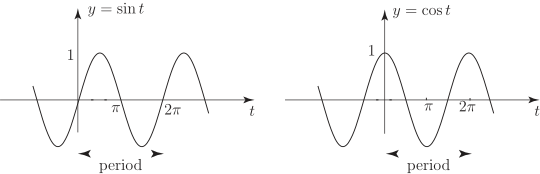
Alt text: The image displays two graphs, one for the sine function, \(y = \text{sin}(t)\), and one for the cosine function, \(y = \text{cos}(t)\), both showing one full period.
This description was generated by AI and has not been verified by a human. If you spot an error, please use the feedback link below.
- The graph on the left plots the sine function, \(y = \text{sin}(t)\), against the independent variable \(t\) on the horizontal axis and the dependent variable \(y\) on the vertical axis.
- This sine wave starts at the origin, passes through its maximum value at \(t = \frac{\text{pi}}{2}\), returns to the \(t\)-axis at \(t = \text{pi}\), reaches its minimum value at \(t = \frac{3\text{pi}}{2}\), and completes one full cycle at \(t = 2\text{pi}\).
- Below the sine graph, an arrow indicates the length of one full period, spanning from \(t = 0\) to \(t = 2\text{pi}\).
- The graph on the right plots the cosine function, \(y = \text{cos}(t)\), against the same axes.
- This cosine wave starts at its maximum value of \(1\) at \(t = 0\), passes through the \(t\)-axis at \(t = \frac{\text{pi}}{2}\), reaches its minimum value at \(t = \frac{3\text{pi}}{2}\), and completes one full cycle at \(t = 2\text{pi}\).
- Below the cosine graph, an arrow indicates the length of one full period, spanning from \(t = 0\) to \(t = 2\text{pi}\).