Long description: Block1fig4
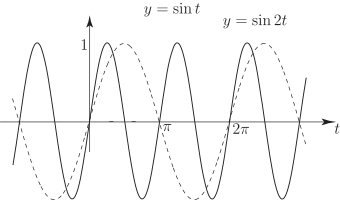
Alt text: The image displays two sinusoidal waves plotted on a coordinate system, representing the functions \(y = \text{sin-}t\) and \(y = \text{sin-}2t\) over an interval from \(t=0\) to \(t=2\text{pi}\).
This description was generated by AI and has not been verified by a human. If you spot an error, please use the feedback link below.
- The graph shows a standard Cartesian coordinate system with the horizontal axis labeled \(t\) and the vertical axis labeled \(y\).
- Two sinusoidal curves are plotted: one solid black line labeled \(y = \text{sin-}t\) and one dashed black line labeled \(y = \text{sin-}2t\).
- Both functions are displayed over an interval on the horizontal axis that spans from \(t=0\) to \(t=2\text{pi}\).
- The function \(y = \text{sin-}t\) (the solid line) completes one full cycle over the interval \([0, 2\text{pi}]\), with maximum values reaching \(y=1\) and minimum values reaching \(y=-1\).
- The function \(y = \text{sin-}2t\) (the dashed line) completes two full cycles over the same interval \([0, 2\text{pi}]\), exhibiting a higher frequency and a compressed appearance compared to \(y = \text{sin-}t\).
- At key points, such as \(t=\text{pi}/2\), \(t=\text{pi}\), and \(t=3\text{pi}/2\), the waves show different vertical positions due to the differing coefficients in their equations.