Long description: Block1fig5
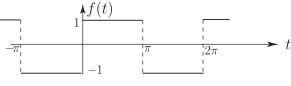
Alt text: A graph showing a periodic square wave function, \(f(t)\), that repeats every two pi units.
This description was generated by AI and has not been verified by a human. If you spot an error, please use the feedback link below.
- The horizontal axis represents time, denoted by \(t\), and the vertical axis represents the function's value, \(f(t)\).
- The function \(f(t)\) is a square wave, which indicates that the function takes on distinct constant values over specified intervals.
- The pattern shown is periodic, repeating across the visible range of the horizontal axis.
- In the interval from negative pi to pi, the function's value is \(-1\).
- In the interval from pi to two pi, the function's value is \(1\).
- This pattern continues, suggesting that the function has a period of \(2\text{ pi}\). (The first full cycle shown appears to span from some value before negative pi to two pi, showing segments of \(-1\) and \(1\)).