Long description: Block1fig6
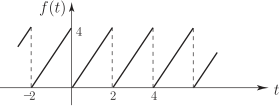
Alt text: A graph showing a periodic function, f(t), composed of connected line segments over time, t.
This description was generated by AI and has not been verified by a human. If you spot an error, please use the feedback link below.
- The graph plots the function \(f(t)\) on the vertical axis against time \(t\) on the horizontal axis.
- The function is represented by a series of straight, diagonal line segments, indicating a periodic wave-like pattern.
- The graph passes through several points, suggesting that the function has a period of 2 units based on the visible segments.
- The graph starts from a negative value at \(t = -2\), rises linearly to a value of 4 at \(t = 0\), drops back down to a negative value, and repeats this pattern across the visible domain of \(t\).