Long description: Block1fig7
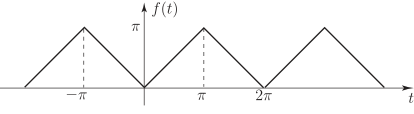
Alt text: The image displays a graph of a periodic function, f(t), shaped like a series of connected triangles.
This description was generated by AI and has not been verified by a human. If you spot an error, please use the feedback link below.
- The graph plots the function \(f(t)\) on the vertical axis against the variable \(t\) on the horizontal axis.
- The function forms a repeating, triangular wave pattern over the visible domain.
- The function reaches its maximum height at \(t = -\frac{\pi}{2}\), \(t = \frac{\pi}{2}\), and \(t = \frac{3\pi}{2}\) (based on the peak locations shown relative to the asymptotes).
- The function's value is zero at \(t = -\frac{\pi}{2}\), \(t = \frac{\pi}{2}\), \(t = \frac{3\pi}{2}\), and at the marked intervals of \(-\pi\), \(0\), \(\pi\), and \(2\pi\).
- The period of the function appears to be \(T = 2\pi\), as the pattern repeats every \(2\pi\) units along the horizontal axis.