Long description: Block1fig8
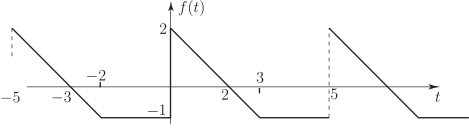
Alt text: The graph shows a periodic function, f(t), defined over time t, with repeating triangular wave patterns.
This description was generated by AI and has not been verified by a human. If you spot an error, please use the feedback link below.
- The horizontal axis represents time, labeled as "t", and the vertical axis represents the function's value, labeled as "f(t)".
- The function exhibits a repeating, piecewise linear pattern, characteristic of a periodic function.
- In the interval from approximately minus five to minus three, the function slopes downward from a positive value towards minus five.
- From the time t equals minus one to t equals two, the function is defined by a set of connected line segments forming a repeating cycle.
- Specifically, the graph shows a pattern starting near t equals minus one, rising linearly to a peak value of two at t equals two, and then sloping back down to a value of zero at t equals three.
- A dashed vertical line is placed at t equals five, indicating a key point in the function's domain or period.
- The overall shape suggests a triangular wave pattern repeating across the time axis.