Long description: Block1fig9
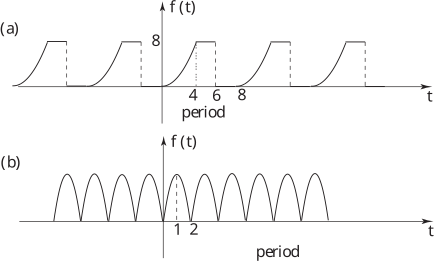
Alt text: The image displays two graphs, (a) and (b), illustrating different types of periodic functions, with time displayed on the horizontal axis labeled 'period' and the function's value on the vertical axis labeled 'f(t)'.
This description was generated by AI and has not been verified by a human. If you spot an error, please use the feedback link below.
- Graph (a) shows a periodic function composed of horizontal rectangular pulses.
- This function appears to have a height of 8 and repeats over time intervals.
- Specifically, the function is non-zero between time values of 0 and 4, between 4 and 8, and continues periodically thereafter.
- Graph (b) shows a periodic function represented by a continuous sine wave or cosine wave pattern.
- This wave oscillates smoothly between a minimum and maximum value, spanning several cycles across the time axis.
- The horizontal axis for both graphs is labeled 'period' and the vertical axis is labeled 'f(t)' for the function's value.