Long description: Block262_Fig7
Alt text: A graph shows two closed curves, labeled with arrows indicating direction, drawn on an x-y coordinate system.
This description was generated by AI and has not been verified by a human. If you spot an error, please use the feedback link below.
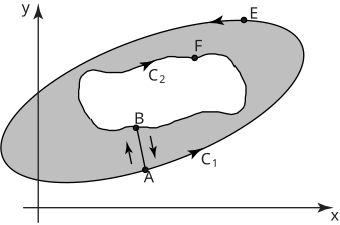
- The image displays a two-dimensional coordinate system with an x-axis and a y-axis.
- Two closed, shaded curves are visible, representing contours or boundaries.
- The outer curve, labeled with a path from the lower right, shows an arrow pointing towards a point labeled E, and the entire curve is drawn with shading underneath it.
- The inner curve, labeled with a path and showing an arrow moving generally left and then slightly up, is situated inside the outer curve.
- Several points are marked on the curves: A is located at the bottom, B is located near the center-left, and E is located on the outer curve toward the top right.
- Arrows are drawn near points A and B, suggesting paths or displacement vectors, with the arrows pointing upwards and downwards respectively, relative to the segment connecting A and B.