Long description: Block262_FigQ2
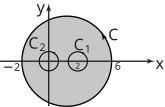
Alt text: A diagram illustrating a contour integral setup in the complex plane with two enclosed circles.
This description was generated by AI and has not been verified by a human. If you spot an error, please use the feedback link below.
- The image displays a coordinate system with a horizontal axis labeled 'x' and a vertical axis labeled 'y', representing the complex plane.
- A large, shaded circular region is enclosed by a larger contour, labeled 'C'.
- Inside this large region, there are two smaller, distinct circular regions.
- The first smaller circle, labeled 'C₂', is centered near \(x = -2\) and \(y = 0\).
- The second smaller circle, labeled 'C₁', is centered near \(x = 2\) and \(y = 0\).
- The context suggests that the integral is being evaluated around the outer contour 'C', while the smaller contours 'C₁' and 'C₂' indicate points of interest or singularities for the function \(f(z) = 4z(z-2)\). The positions suggest that the singularities occur at \(z=0\) and \(z=2\), corresponding to the centers of the depicted circles.