Long description: Fig3713
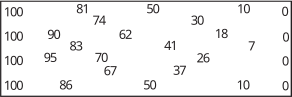
Alt text: The image displays a grid representing temperature values across a plate with one side at 100 degrees Celsius and the other at 0 degrees Celsius.
This description was generated by AI and has not been verified by a human. If you spot an error, please use the feedback link below.
- The data is presented in a grid format, likely showing temperature measurements across a surface.
- The values decrease systematically from the left side (near 100 degrees Celsius) to the right side (approaching 0 degrees Celsius).
- The rows appear to represent parallel measurements taken at a fixed distance from one side, while columns represent measurements taken perpendicular to the direction of heat flow.
- In the top row, the temperatures range from 100 degrees Celsius down to 0 degrees Celsius.
- In the second row, the temperatures are approximately 100, 90, 81, 74, 62, 50, 30, 18, and 0 degrees Celsius.
- The subsequent rows show continued gradients, such as the third row with values starting near 100, 95, 83, 70, 41, 10, and 0 degrees Celsius.
- The pattern suggests a heat gradient, with the temperature gradually dropping as the measurement point moves across the plate from one edge to the other.