Long description: Fig3714
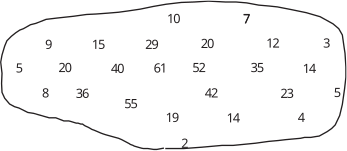
Alt text: A map showing elevation values distributed across an irregularly shaped landmass.
This description was generated by AI and has not been verified by a human. If you spot an error, please use the feedback link below.
- The image displays a topographical representation of a land area, with specific numerical values suggesting elevation above sea level.
- The values arranged across the map range from a low of 2 to a high of 61.
- The values are presented in a grid-like pattern, although the overall shape is irregular.
- Starting from the top left, the values are 9, 15, 29, 10, and 7.
- The second row contains the values 5, 20, 40, 61, 52, 35, and 12.
- The third row shows 8, 36, 55, 29, 42, 23, and 14.
- The fourth row contains 19, 14, and then a sequence of lower values: 2, 4, and 5.
- The bottom edge is marked with the value 2.