Long description: Fig3715
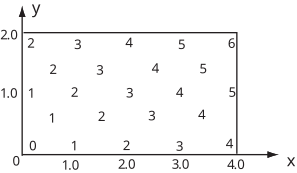
Alt text: A grid displays the value of the scalar field \(\phi(x,y) = x+y\) at discrete points, ranging from 1 to 6.
This description was generated by AI and has not been verified by a human. If you spot an error, please use the feedback link below.
- The image shows a two-dimensional Cartesian grid with the x-axis and y-axis labeled from 0 to 6, with increments marked at 1.0 units.
- The grid is populated with numbers representing the value of the scalar field \(\phi(x,y) = x+y\) at coordinates \((x, y)\).
- The values displayed are:
- At \(y=2.0\): The values are 2 at \((0, 2.0)\), 3 at \((1.0, 2.0)\), 4 at \((2.0, 2.0)\), 5 at \((3.0, 2.0)\), and 6 at \((4.0, 2.0)\).
- At \(y=1.0\): The values are 1 at \((0, 1.0)\), 2 at \((1.0, 1.0)\), 3 at \((2.0, 1.0)\), 4 at \((3.0, 1.0)\), and 5 at \((4.0, 1.0)\).
- At \(y=0.0\): The values are 0 at \((0, 0.0)\), 1 at \((1.0, 0.0)\), 2 at \((2.0, 0.0)\), 3 at \((3.0, 0.0)\), and 4 at \((4.0, 0.0)\).