Long description: Fig3716
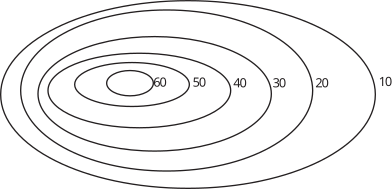
Alt text: The image displays a set of concentric, elliptical contour lines labeled with values ranging from 10 to 60.
This description was generated by AI and has not been verified by a human. If you spot an error, please use the feedback link below.
- The visualization consists of several nested, elliptical contour lines, suggesting a level set plot or field distribution.
- The lines are labeled with specific numerical values, appearing sequentially from the outermost to the innermost contour.
- Visible contour labels include 10, 20, 30, 40, 50, and 60.
- The contours are drawn such that the label 10 is on the outermost, largest ellipse, and the label 60 is near the center of the innermost ellipse.
- The shape of the contours is uniformly elliptical across the displayed range of values.