Long description: Fig3717
Alt text: The image displays two separate graphs, (a) and (b), showing sets of contour lines labeled with different constant values.
This description was generated by AI and has not been verified by a human. If you spot an error, please use the feedback link below.
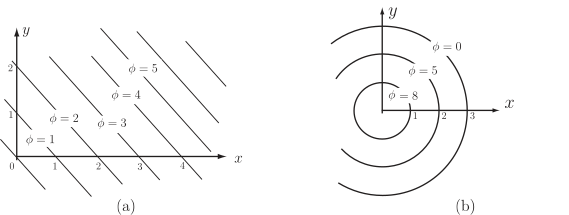
- On the left graph, labeled (a), the contour lines are straight lines with a positive slope, representing contours for the function \(x+y\).
- These lines are labeled with constant values such as \(\phi = 1\), \(\phi = 2\), \(\phi = 3\), \(\phi = 4\), and \(\phi = 5\), indicating that the level curves are parallel lines moving upwards from the \(x\)-axis.
- On the right graph, labeled (b), the contour lines are concentric closed curves centered around the origin, representing contours for the function \(9-x^2 -y^2\).
- These contours are also labeled with constant values, including \(\phi = 0\), \(\phi = 5\), and \(\phi = 8\), forming nested ellipses or circles.