Long description: Fig3721
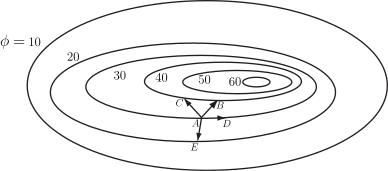
Alt text: A contour map, labeled with elevation values, shows several connected points labeled A, B, C, D, and E.
This description was generated by AI and has not been verified by a human. If you spot an error, please use the feedback link below.
- The image is a contour map shaped like an ellipse, illustrating varying elevation levels.
- The contours are labeled with values, decreasing from the outer edge, which is labeled \(\phi = -10\), inwards towards a central high point.
- Visible contour lines include values of \(20\), \(30\), \(40\), \(50\), and \(60\).
- Several points are marked on the map: A, B, C, D, and E.
- The points C, A, and D appear relatively close to each other, with C to the left and D to the right of A.
- Point B is located near the peak of the contours, slightly above and between C and D.
- Point E is located below the main cluster of points (A, B, C, D), suggesting a lower elevation relative to the labeled contours at that specific location.