Long description: waveexample
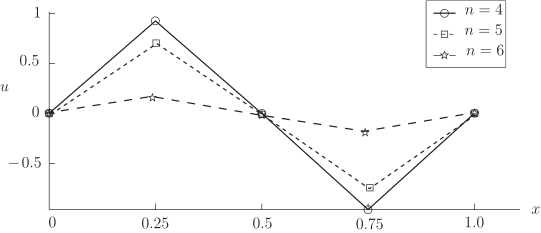
Alt text: A line graph illustrating the behavior of a function, denoted by \(u\), as a function of \(x\) for different values of \(n\) (specifically \(n=4, 5, \text{ and } 6\)).
This description was generated by AI and has not been verified by a human. If you spot an error, please use the feedback link below.
- The graph plots the dependent variable \(u\) on the vertical axis against the independent variable \(x\) on the horizontal axis, with values ranging from \(0\) to \(1\) for both axes.
- Three different datasets are shown, corresponding to \(n=4\) (represented by open circles and a solid line), \(n=5\) (represented by open squares and a dashed line), and \(n=6\) (represented by open stars and a dashed line).
- All three functions start at the point \((0, 0)\) on the left edge of the graph.
- At \(x=0.25\), the function for \(n=4\) reaches its peak value of approximately \(1.0\), while \(n=5\) is at a value slightly less than \(1.0\), and \(n=6\) is at a value around \(0.0\).
- The function for \(n=4\) decreases smoothly, passing through \((0.5, 0)\) and reaching its minimum value of approximately \(-0.8\) at \(x=0.75\).
- The function for \(n=5\) decreases from its starting point, passing through \((0.5, 0)\), and reaches a minimum value of approximately \(-0.2\) at \(x=0.75\).
- The function for \(n=6\) remains relatively close to the horizontal axis, passing through \((0.5, 0)\) and reaching a value of approximately \(-0.1\) at \(x=0.75\).
- All three functions end at the point \((1.0, 0)\) on the right edge of the graph.