Long description: block3fig1
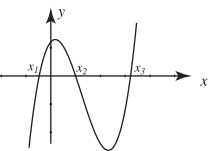
Alt text: The graph shows a polynomial function crossing the x-axis at three points labeled \(x_1\), \(x_2\), and \(x_3\).
This description was generated by AI and has not been verified by a human. If you spot an error, please use the feedback link below.
- The image displays a Cartesian coordinate system with a polynomial function graphed on it, plotted with respect to the horizontal axis labeled \(x\) and the vertical axis labeled \(y\).
- The curve is a wave-like polynomial that intersects the horizontal \(x\)-axis at three distinct points.
- These points of intersection are labeled \(x_1\), \(x_2\), and \(x_3\), indicating the real roots or zeros of the polynomial function.
- The function starts from a high value on the left, crosses the \(x\)-axis at \(x_1\), reaches a local maximum, decreases to cross the \(x\)-axis at \(x_2\), reaches a local minimum, and then increases, crossing the \(x\)-axis again at \(x_3\) before continuing upward.