Long description: Trig6Fig13
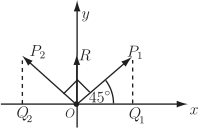
Alt text: A graph showing three points, \(P_1\), \(P_2\), and \(R\), plotted on a coordinate system with an angle of \(45\) degrees marked.
This description was generated by AI and has not been verified by a human. If you spot an error, please use the feedback link below.
- The image displays a standard two-dimensional Cartesian coordinate system with the horizontal axis labeled \(x\) and the vertical axis labeled \(y\).
- Three points are marked: \(P_1\), \(P_2\), and \(R\).
- The point \(P_1\) is located in the first quadrant, connected by a dashed line to a point on the \(x\)-axis labeled \(Q_1\).
- The point \(P_2\) is located in the second quadrant, connected by a dashed line to a point on the \(x\)-axis labeled \(Q_2\).
- The point \(R\) is plotted in the first quadrant, and the angle formed by the line segment \(OR\) and the positive \(x\)-axis is labeled as \(45\) degrees.
- The drawing illustrates trigonometric relationships using these points and the labeled angle.